SARRON A.
TADESSE

Data Scientist / Machine Learning / Software & Analytics Engineering

San Francisco, CA

[ 01 ] · About me

I turn complex, high-volume data into decisions people act on.

One of the things I've come to appreciate most is how transferable data skills are. You can find yourself in an industry or problem space you never expected and still use data to understand what's happening and improve how things are done.

My academic and professional experiences have exposed me to very different types of work, and while the problems themselves may vary, data has consistently been the tool that connects them. That contrast has made me even more interested in exploring how data can be applied across different industries. I enjoy learning unfamiliar domains, finding patterns, and turning information into something people can use.

Python · SQL · PostgreSQL · R · JavaScript · Pandas · NumPy · Excel · Power BI · Tableau · Google Analytics · Google Ads · Git · AWS · Scikit-learn · TensorFlow · FAISS · LLMs · Elasticsearch · Streamlit

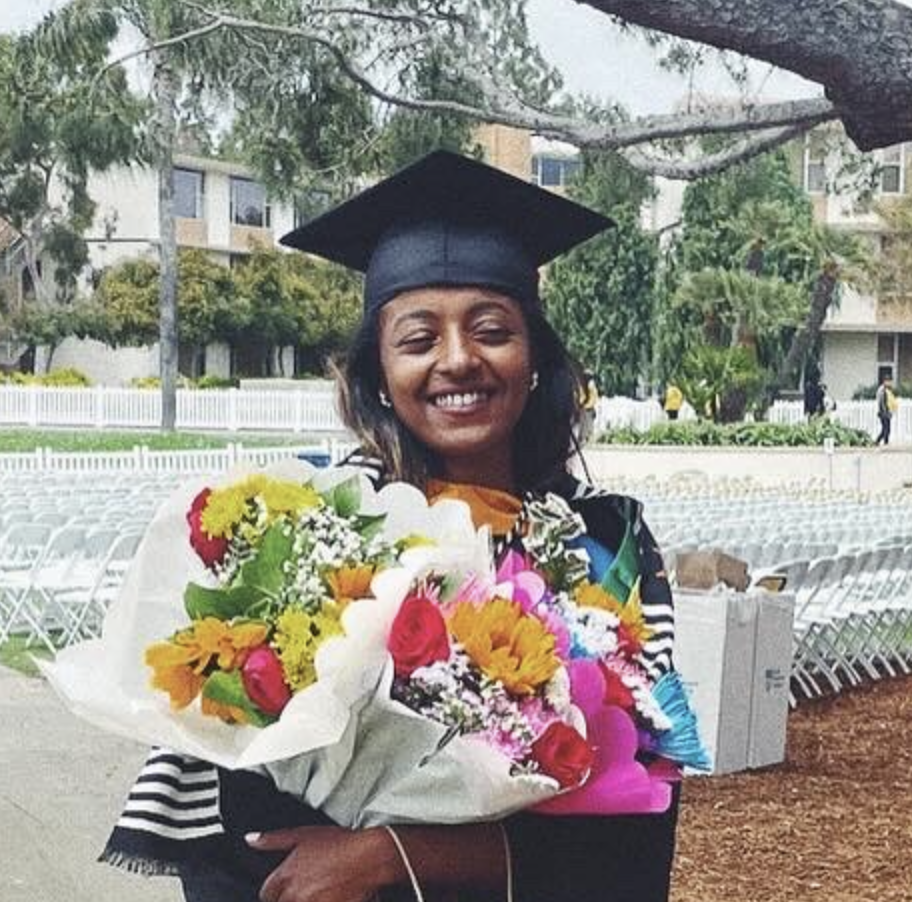
Sarron A. Tadesse headshot

[ 02 ] · Experience

Where I've worked

Nov 2024 – Present

Junior Engineer

BART (Bay Area Rapid Transit) · Oakland, CA

  • →Built a verified history of train false-occupancy events, cases where the signaling system reports a train on an empty track, by combining equipment logs, work orders, and manager notes, then cross-checking every date, location, and incident detail to resolve duplicates and conflicts. My SQL and Python analysis identified low receiver thresholds (~32.7%) and data-bit mismatch (~30%) as the leading cause groups, with wiring issues (~15%) as another contributing cause.
  • →Analyzed passage logs, AI-camera detections, and field observations at three case-study stations to pinpoint where and when fare piggybacking concentrates. Those insights informed fare-gate software changes credited with a 30% decline in observed fare evasion, with improvements still rolling out. Found ADA gates drove ~40% of incidents and built Power BI dashboards to target mitigation pilots.
  • →Extending my internship prototype, the fully offline RAG system, into a full Elasticsearch-based platform that ingests work orders and manuals, generates embeddings, and retrieves source-backed historical fixes, so technicians can troubleshoot faster in their day-to-day work. Designed for secure on-premises and hosted deployment.

Jun 2024 – Aug 2024

Computer Science Intern

BART (Bay Area Rapid Transit) · Oakland, CA

  • →Engineered a fully offline RAG maintenance assistant in Python: text chunking, embeddings, FAISS similarity search, and local open-source LLMs indexing five years of work orders and technical manuals, with zero sensitive operational data exposed to cloud services.
  • →Designed the end-to-end retrieval and ranking workflow so technicians could describe issues in natural language and receive grounded guidance from prior fixes and source manuals instead of keyword-only results.
  • →Built the Streamlit interface and partnered with maintenance staff to validate recommendation quality, refine retrieval, and improve usability.
Read the full case study

Jan 2024 – Apr 2024

Data Science Program Participant

Massachusetts Institute of Technology · Cambridge, MA

  • →Completed a four-month, industry-mentored program with end-to-end projects in forecasting, computer vision, and classification, cleaning and modeling 10+ GB of data with Python, SQL, Pandas, Scikit-learn, and TensorFlow.
  • →Built end-to-end projects across the program: an ARIMA sales forecast reaching 92% accuracy, a TensorFlow malaria-detection CNN at 85% precision, handwritten digit recognition, a movie recommendation system, geographic clustering, and market analysis.

Jan 2022 – Apr 2023

Student Bioinformatics Researcher

Loyola Marymount University · Los Angeles, CA

  • →Contributed to GRNsight, an open-source bioinformatics tool that visualizes gene regulatory networks, showing how genes and proteins affect one another, by debugging front-end behavior and tracing PostgreSQL-backed gene-network data so those relationships rendered accurately in interactive visualizations.
  • →Presented the work to 200+ attendees at LMU's annual research symposium, showing other departments how data and technology can unlock real value in biological research and bridging computer science and biology in a way audiences from both fields could act on.

[ 03 ] · Side projects & school work

Project links included for viewing (GitHub or Google Colab).

Side projects + school work

[05]

Mini ChatGPT Project

A compact conversational AI built in a notebook: prompt handling, response generation, and an interactive chat workflow from scratch.

ColabPythonNLPLLMs
[06]

Employee Attrition Project

Predicting employee turnover through exploratory analysis, feature engineering, and classification modeling on HR data to surface retention risks.

ColabPythonClassificationPandas
[07]

Inferential Statistics

Hypothesis testing, confidence intervals, and statistical inference applied to real datasets. A full notebook study in drawing defensible conclusions.

ColabStatisticsPythonSciPy
[08]

Movie Recommendation System

A recommender that scores similarity across movie data and serves up what to watch next. Built end-to-end in a notebook.

ColabPythonRecommenderPandas
[09]

Geographic Clustering Project

Unsupervised clustering of geographic data, grouping locations by pattern and visualizing the segments that emerge.

ColabClusteringScikit-learnGeo
[10]

Digit Recognition Project

End-to-end classification on handwritten digits, from feature engineering and model training to evaluation, built during MIT's industry-mentored program.

ColabScikit-learnClassification
[11]

Market Analysis Project

Market data exploration covering trends, segmentation, and decision-ready insights packaged in a notebook study.

ColabPythonEDAVisualization
[12]

Sales Forecasting: ARIMA

Explored trend and seasonality in historical sales data, then built and evaluated an ARIMA model against actuals, reaching 92% forecasting accuracy.

ColabPythonARIMAPandasMatplotlib
[13]

LMU Datathon, 3rd Place

Led a four-person team through a 24-hour competition analyzing EPA contract data in R and Tableau, surfacing opportunities for underrepresented businesses.

RTableauAward
[14]

Marketing & Growth Analytics: CTTG Nonprofit

Volunteer analytics work: dug into Google Analytics and Google Ads campaign data to understand how people discover the nonprofit, found tracking gaps, and sharpened campaign measurement.

Google AnalyticsGoogle AdsVolunteer

[ 04 ] · Education

The foundation

Sep 2024 – Expected Aug 2027

M.S., Data Science & Engineering

University of California, Los Angeles

Online, while working full-time at BART.

Aug 2020 – May 2024

B.S., Computer Science

Loyola Marymount University

Bioinformatics research · Datathon 3rd place · Symposium presenter.

Jan 2024 – Apr 2024

Data Science Program

Massachusetts Institute of Technology

Online program mentored by industry leads, with hands-on projects in forecasting, computer vision, and classification tied to real industry problems.

[ 05 ] · Contact

Let's Connect.

© 2026 Sarron A. Tadesse · Designed & built with intent.